


Monitoring
This guide explains how to monitor the NooBaa operator and related components using Prometheus and Grafana. It covers recommended setup, how to expose metrics, example ServiceMonitor manifests, basic alerting rules and troubleshooting steps.
Overview
NooBaa components expose Prometheus-compatible metrics. By scraping these metrics with Prometheus you can build dashboards and alerts to observe health, performance, and capacity of object storage resources managed by NooBaa.
This document assumes you have a Kubernetes cluster and cluster-admin privileges for installing monitoring components.
Prerequisites
- A running Kubernetes cluster
- kubectl configured for your cluster
- A Prometheus instance that can be extended with ServiceMonitor resources (for example the Prometheus Operator / kube-prometheus-stack)
- Grafana (optional but recommended) for dashboards
Recommended monitoring stack
- Prometheus (scrapes metrics and evaluates alerting rules)
- Alertmanager (handles notifications)
- Grafana (dashboards)
You can install a complete monitoring stack using community packages (for example, the kube-prometheus-stack Helm chart) or by installing the Prometheus Operator and related manifests.
Installing the Prometheus Operator
Prometheus Operator provides a simple and Kubernetes native way to deploy and configure a Prometheus server. This tutorial will show you how to use the Prometheus operator for monitoring KubeStash.
To keep Prometheus resources isolated, we are going to use a separate namespace monitoring to deploy the Prometheus operator and respective resources. Create the namespace if you haven’t created it yet,
$ kubectl create ns monitoring
namespace/monitoring created
Install Prometheus Stack
At first, you have to install Prometheus operator in your cluster. In this section, we are going to install Prometheus operator from prometheus-community/kube-prometheus-stack. You can skip this section if you already have Prometheus operator running.
Install prometheus-community/kube-prometheus-stack chart as below,
- Add necessary helm repositories.
helm repo add prometheus-community https://prometheus-community.github.io/helm-charts
helm repo update
- Install
kube-prometheus-stackchart.
helm install prometheus-stack prometheus-community/kube-prometheus-stack -n monitoring
This chart will install prometheus-operator/prometheus-operator, kubernetes/kube-state-metrics, prometheus/node_exporter, and grafana/grafana etc.
The above chart will also deploy a Prometheus server. Verify that the Prometheus server has been deployed by the following command:
$ kubectl get prometheus -n monitoring
NAME                                    VERSION   DESIRED   READY   RECONCILED   AVAILABLE   AGE
prometheus-stack-kube-prom-prometheus   v3.6.0    1         1       True         True        37s
The above chart will also create a Service for the Prometheus server so that we can access the Prometheus Web UI. Let’s verify the Service has been created,
$ kubectl get service -n monitoring
NAME                                        TYPE        CLUSTER-IP      EXTERNAL-IP   PORT(S)                      AGE
alertmanager-operated                       ClusterIP   None            <none>        9093/TCP,9094/TCP,9094/UDP   68s
prometheus-operated                         ClusterIP   None            <none>        9090/TCP                     68s
prometheus-stack-grafana                    ClusterIP   10.43.143.53    <none>        80/TCP                       69s
prometheus-stack-kube-prom-alertmanager     ClusterIP   10.43.187.121   <none>        9093/TCP,8080/TCP            69s
prometheus-stack-kube-prom-operator         ClusterIP   10.43.223.96    <none>        443/TCP                      69s
prometheus-stack-kube-prom-prometheus       ClusterIP   10.43.62.135    <none>        9090/TCP,8080/TCP            69s
prometheus-stack-kube-state-metrics         ClusterIP   10.43.108.193   <none>        8080/TCP                     69s
prometheus-stack-prometheus-node-exporter   ClusterIP   10.43.137.87    <none>        9100/TCP                     69s
Here, we can use the prometheus-stack-kube-prom-prometheus Service to access the Web UI of our Prometheus Server.
Let’s check the YAML of the above Prometheus object,
$ kubectl get prometheus -n monitoring prometheus-stack-kube-prom-prometheus -o yaml
apiVersion: monitoring.coreos.com/v1
kind: Prometheus
metadata:
  annotations:
    meta.helm.sh/release-name: prometheus-stack
    meta.helm.sh/release-namespace: monitoring
  creationTimestamp: "2025-09-26T10:08:57Z"
  generation: 1
  labels:
    app: kube-prometheus-stack-prometheus
    app.kubernetes.io/instance: prometheus-stack
    app.kubernetes.io/managed-by: Helm
    app.kubernetes.io/part-of: kube-prometheus-stack
    app.kubernetes.io/version: 77.11.1
    chart: kube-prometheus-stack-77.11.1
    heritage: Helm
    release: prometheus-stack
  name: prometheus-stack-kube-prom-prometheus
  namespace: monitoring
  resourceVersion: "1472782"
  uid: 51293bd9-1df1-4f0b-893c-346409811a66
spec:
  affinity:
    podAntiAffinity:
      preferredDuringSchedulingIgnoredDuringExecution:
        - podAffinityTerm:
            labelSelector:
              matchExpressions:
                - key: app.kubernetes.io/name
                  operator: In
                  values:
                    - prometheus
                - key: app.kubernetes.io/instance
                  operator: In
                  values:
                    - prometheus-stack-kube-prom-prometheus
            topologyKey: kubernetes.io/hostname
          weight: 100
  alerting:
    alertmanagers:
      - apiVersion: v2
        name: prometheus-stack-kube-prom-alertmanager
        namespace: monitoring
        pathPrefix: /
        port: http-web
  automountServiceAccountToken: true
  enableAdminAPI: false
  enableOTLPReceiver: false
  evaluationInterval: 30s
  externalUrl: http://prometheus-stack-kube-prom-prometheus.monitoring:9090
  hostNetwork: false
  image: quay.io/prometheus/prometheus:v3.6.0
  imagePullPolicy: IfNotPresent
  listenLocal: false
  logFormat: logfmt
  logLevel: info
  paused: false
  podMonitorNamespaceSelector: {}
  podMonitorSelector:
    matchLabels:
      release: prometheus-stack
  portName: http-web
  probeNamespaceSelector: {}
  probeSelector:
    matchLabels:
      release: prometheus-stack
  replicas: 1
  retention: 10d
  routePrefix: /
  ruleNamespaceSelector: {}
  ruleSelector:
    matchLabels:
      release: prometheus-stack
  scrapeConfigNamespaceSelector: {}
  scrapeConfigSelector:
    matchLabels:
      release: prometheus-stack
  scrapeInterval: 30s
  securityContext:
    fsGroup: 2000
    runAsGroup: 2000
    runAsNonRoot: true
    runAsUser: 1000
    seccompProfile:
      type: RuntimeDefault
  serviceAccountName: prometheus-stack-kube-prom-prometheus
  serviceMonitorNamespaceSelector: {}
  serviceMonitorSelector:
    matchLabels:
      release: prometheus-stack
  shards: 1
  tsdb:
    outOfOrderTimeWindow: 0s
  version: v3.6.0
  walCompression: true
status:
  availableReplicas: 1
  conditions:
    - lastTransitionTime: "2025-09-26T10:09:29Z"
      message: ""
      observedGeneration: 1
      reason: ""
      status: "True"
      type: Available
    - lastTransitionTime: "2025-09-26T10:09:29Z"
      message: ""
      observedGeneration: 1
      reason: ""
      status: "True"
      type: Reconciled
  paused: false
  replicas: 1
  selector: app.kubernetes.io/instance=prometheus-stack-kube-prom-prometheus,app.kubernetes.io/managed-by=prometheus-operator,app.kubernetes.io/name=prometheus,operator.prometheus.io/name=prometheus-stack-kube-prom-prometheus,prometheus=prometheus-stack-kube-prom-prometheus
  shardStatuses:
    - availableReplicas: 1
      replicas: 1
      shardID: "0"
      unavailableReplicas: 0
      updatedReplicas: 1
  shards: 1
  unavailableReplicas: 0
  updatedReplicas: 1
Notice the following ServiceMonitor related sections,
serviceMonitorNamespaceSelector: {} # select from all namespaces
serviceMonitorSelector:
  matchLabels:
    release: prometheus-stack
Here, you can see the Prometheus server is selecting the ServiceMonitors from all namespaces that have release: prometheus-stack label.
Annotating the NooBaa Service
So, we have to annotate the NooBaa Service which is used by the Prometheus Operator to scrape the NooBaa metrics.
kubectl label servicemonitor -n noobaa s3-service-monitor release=prometheus-stack
kubectl label servicemonitor -n noobaa noobaa-mgmt-service-monitor release=prometheus-stack
Exposing NooBaa metrics
NooBaa components by default expose Prometheus metrics on an HTTP endpoint (typically /metrics). To allow Prometheus to scrape these metrics in a cluster using the Prometheus Operator, It also by default create a ServiceMonitor that selects the pod(s) exposing metrics.
Below given what servicemonitor does NooBaa controller expose:
➤ kubectl get servicemonitors.monitoring.coreos.com -n noobaa
NAME                          AGE
noobaa-mgmt-service-monitor   7d3h
s3-service-monitor            7d3h


➤ kubectl get servicemonitors.monitoring.coreos.com -n noobaa noobaa-mgmt-service-monitor -o yaml
apiVersion: monitoring.coreos.com/v1
kind: ServiceMonitor
metadata:
  creationTimestamp: "2025-09-19T06:11:22Z"
  generation: 1
  labels:
    app: noobaa
    release: prometheus-stack
  name: noobaa-mgmt-service-monitor
  namespace: noobaa
  ownerReferences:
  - apiVersion: noobaa.io/v1alpha1
    blockOwnerDeletion: true
    controller: true
    kind: NooBaa
    name: noobaa
    uid: ad72436d-ed05-43db-927e-81b19b5a6507
  resourceVersion: "437882"
  uid: 599c845f-9ade-4f4c-954b-c1063e6a2acf
spec:
  endpoints:
  - authorization:
      credentials:
        key: metrics_token
        name: noobaa-metrics-auth-secret
      type: Bearer
    path: /metrics/web_server
    port: mgmt
  - authorization:
      credentials:
        key: metrics_token
        name: noobaa-metrics-auth-secret
      type: Bearer
    path: /metrics/bg_workers
    port: mgmt
  - authorization:
      credentials:
        key: metrics_token
        name: noobaa-metrics-auth-secret
      type: Bearer
    path: /metrics/hosted_agents
    port: mgmt
  namespaceSelector: {}
  selector:
    matchLabels:
      noobaa-mgmt-svc: "true"


➤ kubectl get servicemonitors.monitoring.coreos.com -n noobaa s3-service-monitor -o yaml
apiVersion: monitoring.coreos.com/v1
kind: ServiceMonitor
metadata:
  creationTimestamp: "2025-09-19T06:11:22Z"
  generation: 1
  labels:
    app: noobaa
    release: prometheus-stack
  name: s3-service-monitor
  namespace: noobaa
  ownerReferences:
  - apiVersion: noobaa.io/v1alpha1
    blockOwnerDeletion: true
    controller: true
    kind: NooBaa
    name: noobaa
    uid: ad72436d-ed05-43db-927e-81b19b5a6507
  resourceVersion: "437881"
  uid: 101f2e01-0bc8-48de-bb80-582d1ba94fd1
spec:
  endpoints:
  - authorization:
      credentials:
        key: metrics_token
        name: noobaa-metrics-auth-secret
      type: Bearer
    path: /
    port: metrics
  namespaceSelector: {}
  selector:
    matchLabels:
      noobaa-s3-svc: "true"
PrometheusRule
While Installing the NooBaa operator, the Prometheus Operator creates a PrometheusRule object that defines a set of alerting rules.
➤ kubectl get prometheusrules.monitoring.coreos.com -n noobaa
NAME                      AGE
noobaa-prometheus-rules   7d3h


anisur@anisur-pc:~/g/s/g/a/kubebuilder-test
➤ kubectl get prometheusrules.monitoring.coreos.com -n noobaa noobaa-prometheus-rules -o yaml
apiVersion: monitoring.coreos.com/v1
kind: PrometheusRule
metadata:
  annotations:
    prometheus-operator-validated: "true"
  creationTimestamp: "2025-09-19T06:11:22Z"
  generation: 1
  labels:
    prometheus: k8s
    role: alert-rules
  name: noobaa-prometheus-rules
  namespace: noobaa
  ownerReferences:
  - apiVersion: noobaa.io/v1alpha1
    blockOwnerDeletion: true
    controller: true
    kind: NooBaa
    name: noobaa
    uid: ad72436d-ed05-43db-927e-81b19b5a6507
  resourceVersion: "435004"
  uid: 8f073466-9f3f-403b-b4d2-8002f4418cf8
spec:
  groups:
  - name: noobaa-telemeter.rules
    rules:
    - expr: |
        sum(NooBaa_num_unhealthy_buckets + NooBaa_num_unhealthy_bucket_claims)
      record: job:noobaa_total_unhealthy_buckets:sum
    - expr: |
        NooBaa_num_unhealthy_namespace_buckets
      record: job:noobaa_total_unhealthy_namespace_buckets
    - expr: |
        sum(NooBaa_num_buckets + NooBaa_num_buckets_claims)
      record: job:noobaa_bucket_count:sum
    - expr: |
        NooBaa_num_namespace_buckets
      record: job:noobaa_namespace_bucket_count
    - expr: |
        sum(NooBaa_num_objects + NooBaa_num_objects_buckets_claims)
      record: job:noobaa_total_object_count:sum
    - expr: |
        NooBaa_accounts_num
      record: noobaa_accounts_num
    - expr: |
        NooBaa_total_usage
      record: noobaa_total_usage
  - name: noobaa-odf.rules
    rules:
    - expr: |
        NooBaa_odf_health_status
      labels:
        system_type: OCS
        system_vendor: Red Hat
      record: odf_system_health_status
    - expr: |
        NooBaa_total_usage
      labels:
        system_type: OCS
        system_vendor: Red Hat
      record: odf_system_raw_capacity_used_bytes
    - expr: |
        sum by (namespace, managedBy, job, service) (rate(NooBaa_providers_ops_read_num[5m]) + rate(NooBaa_providers_ops_write_num[5m]))
      labels:
        system_type: OCS
        system_vendor: Red Hat
      record: odf_system_iops_total_bytes
    - expr: |
        sum by (namespace, managedBy, job, service) (rate(NooBaa_providers_bandwidth_read_size[5m]) + rate(NooBaa_providers_bandwidth_write_size[5m]))
      labels:
        system_type: OCS
        system_vendor: Red Hat
      record: odf_system_throughput_total_bytes
    - expr: |
        sum(NooBaa_num_buckets + NooBaa_num_buckets_claims)
      labels:
        system_type: OCS
        system_vendor: Red Hat
      record: odf_system_bucket_count
    - expr: |
        sum(NooBaa_num_objects + NooBaa_num_objects_buckets_claims)
      labels:
        system_type: OCS
        system_vendor: Red Hat
      record: odf_system_objects_total
  - name: noobaa-replication.rules
    rules:
    - expr: |
        sum_over_time(sum by (replication_id) (NooBaa_replication_last_cycle_writes_size)[1y:6m])
      record: noobaa_replication_total_writes_size
    - expr: |
        sum_over_time(sum by (replication_id) (NooBaa_replication_last_cycle_writes_num)[1y:6m])
      record: noobaa_replication_total_writes_num
    - expr: |
        sum_over_time(sum by (replication_id) (NooBaa_replication_last_cycle_error_writes_size)[1y:6m])
      record: noobaa_replication_total_error_writes_size
    - expr: |
        sum_over_time(sum by (replication_id) (NooBaa_replication_last_cycle_error_writes_num)[1y:6m])
      record: noobaa_replication_total_error_writes_num
    - expr: |
        count_over_time(count by (replication_id) (NooBaa_replication_last_cycle_writes_size)[1y:6m])
      record: noobaa_replication_total_cycles
  - name: bucket-state-alert.rules
    rules:
    - alert: NooBaaBucketErrorState
      annotations:
        description: A NooBaa bucket {{ $labels.bucket_name }} is in error state for
          more than 5m
        message: A NooBaa Bucket Is In Error State
        severity_level: warning
        storage_type: NooBaa
      expr: |
        NooBaa_bucket_status{bucket_name=~".*"} == 0
      for: 5m
      labels:
        severity: warning
    - alert: NooBaaNamespaceBucketErrorState
      annotations:
        description: A NooBaa namespace bucket {{ $labels.bucket_name }} is in error
          state for more than 5m
        message: A NooBaa Namespace Bucket Is In Error State
        severity_level: warning
        storage_type: NooBaa
      expr: |
        NooBaa_namespace_bucket_status{bucket_name=~".*"} == 0
      for: 5m
      labels:
        severity: warning
    - alert: NooBaaBucketReachingSizeQuotaState
      annotations:
        description: A NooBaa bucket {{ $labels.bucket_name }} is using {{ printf
          "%0.0f" $value }}% of its quota
        message: A NooBaa Bucket Is In Reaching Size Quota State
        severity_level: warning
        storage_type: NooBaa
      expr: |
        NooBaa_bucket_size_quota{bucket_name=~".*"} > 80
      for: 5m
      labels:
        severity: warning
    - alert: NooBaaBucketExceedingSizeQuotaState
      annotations:
        description: A NooBaa bucket {{ $labels.bucket_name }} is exceeding its size
          quota - {{ printf "%0.0f" $value }}% used
        message: A NooBaa Bucket Is In Exceeding Size Quota State
        severity_level: warning
        storage_type: NooBaa
      expr: |
        NooBaa_bucket_size_quota{bucket_name=~".*"} >= 100
      for: 5m
      labels:
        severity: warning
    - alert: NooBaaBucketReachingQuantityQuotaState
      annotations:
        description: A NooBaa bucket {{ $labels.bucket_name }} is using {{ printf
          "%0.0f" $value }}% of its quantity quota
        message: A NooBaa Bucket Is In Reaching Quantity Quota State
        severity_level: warning
        storage_type: NooBaa
      expr: |
        NooBaa_bucket_quantity_quota{bucket_name=~".*"} > 80
      for: 5m
      labels:
        severity: warning
    - alert: NooBaaBucketExceedingQuantityQuotaState
      annotations:
        description: A NooBaa bucket {{ $labels.bucket_name }} is exceeding its quantity
          quota - {{ printf "%0.0f" $value }}% used
        message: A NooBaa Bucket Is In Exceeding Quantity Quota State
        severity_level: warning
        storage_type: NooBaa
      expr: |
        NooBaa_bucket_quantity_quota{bucket_name=~".*"} >= 100
      for: 5m
      labels:
        severity: warning
    - alert: NooBaaBucketLowCapacityState
      annotations:
        description: A NooBaa bucket {{ $labels.bucket_name }} is using {{ printf
          "%0.0f" $value }}% of its capacity
        message: A NooBaa Bucket Is In Low Capacity State
        severity_level: warning
        storage_type: NooBaa
      expr: |
        NooBaa_bucket_capacity{bucket_name=~".*"} > 80
      for: 5m
      labels:
        severity: warning
    - alert: NooBaaBucketNoCapacityState
      annotations:
        description: A NooBaa bucket {{ $labels.bucket_name }} is using all of its
          capacity
        message: A NooBaa Bucket Is In No Capacity State
        severity_level: warning
        storage_type: NooBaa
      expr: |
        NooBaa_bucket_capacity{bucket_name=~".*"} > 95
      for: 5m
      labels:
        severity: warning
  - name: resource-state-alert.rules
    rules:
    - alert: NooBaaResourceErrorState
      annotations:
        description: A NooBaa resource {{ $labels.resource_name }} is in error state
          for more than 5m
        message: A NooBaa Resource Is In Error State
        severity_level: warning
        storage_type: NooBaa
      expr: |
        NooBaa_resource_status{resource_name=~".*"} == 0
      for: 5m
      labels:
        severity: warning
    - alert: NooBaaNamespaceResourceErrorState
      annotations:
        description: A NooBaa namespace resource {{ $labels.namespace_resource_name
          }} is in error state for more than 5m
        message: A NooBaa Namespace Resource Is In Error State
        severity_level: warning
        storage_type: NooBaa
      expr: |
        NooBaa_namespace_resource_status{namespace_resource_name=~".*"} == 0
      for: 5m
      labels:
        severity: warning
  - name: system-capacity-alert.rules
    rules:
    - alert: NooBaaSystemCapacityWarning85
      annotations:
        description: A NooBaa system is approaching its capacity, usage is more than
          85%
        message: A NooBaa System Is Approaching Its Capacity
        severity_level: warning
        storage_type: NooBaa
      expr: |
        NooBaa_system_capacity > 85
      for: 5m
      labels:
        severity: warning
    - alert: NooBaaSystemCapacityWarning95
      annotations:
        description: A NooBaa system is approaching its capacity, usage is more than
          95%
        message: A NooBaa System Is Approaching Its Capacity
        severity_level: critical
        storage_type: NooBaa
      expr: |
        NooBaa_system_capacity > 95
      for: 5m
      labels:
        severity: critical
    - alert: NooBaaSystemCapacityWarning100
      annotations:
        description: A NooBaa system approached its capacity, usage is at 100%
        message: A NooBaa System Approached Its Capacity
        severity_level: critical
        storage_type: NooBaa
      expr: |
        NooBaa_system_capacity == 100
      for: 5m
      labels:
        severity: critical
  - name: noobaa-db-alert.rules
    rules:
    - alert: NooBaaDatabaseReachingCapacity
      annotations:
        description: The NooBaa database on pod {{ $labels.pod }} has reached 80%
          of its PVC capacity.
        message: The NooBaa database on pod {{ $labels.pod }} is consuming 80% of
          its PVC capacity. Plan to increase the PVC size soon to prevent service
          impact.
        severity_level: warning
        storage_type: NooBaa
      expr: |
        ((sum by (pod) (cnpg_collector_pg_wal{value="size"})
        + sum by (pod) (cnpg_pg_database_size_bytes{datname="nbcore"}))
        /
        sum by (pod) (
        label_replace(kube_persistentvolumeclaim_resource_requests_storage_bytes{namespace="noobaa"}, "pod", "$1", "persistentvolumeclaim", "(.*)"
        ))) * 100 > 80
      for: 5m
      labels:
        severity: warning
    - alert: NooBaaDatabaseStorageFull
      annotations:
        description: The NooBaa database on pod {{ $labels.pod }} has exceeded 90%
          of its PVC capacity. Immediate action is required
        message: The NooBaa database on pod {{ $labels.pod }} has exceeded 90% of
          its PVC capacity. Expand the PVC size now to avoid imminent service disruption.
        severity_level: critical
        storage_type: NooBaa
      expr: |
        ((sum by (pod) (cnpg_collector_pg_wal{value="size"})
        + sum by (pod) (cnpg_pg_database_size_bytes{datname="nbcore"}))
        /
        sum by (pod) (
        label_replace(kube_persistentvolumeclaim_resource_requests_storage_bytes{namespace="noobaa"}, "pod", "$1", "persistentvolumeclaim", "(.*)"
        ))) * 100 > 90
      for: 1m
      labels:
        severity: critical
Grafana dashboards
At first, let’s port-forward the respective service for the Grafana dashboard so that we can access it through our browser locally.
$ kubectl port-forward -n monitoring service/prometheus-stack-grafana 3000:80
Forwarding from 127.0.0.1:3000 -> 3000
Forwarding from [::1]:3000 -> 3000
Now, go to http://localhost:3000 in your browser and login to your Grafana UI. If you followed the Prometheus Operator guide to deploy your Prometheus stack, then the default username and password should be admin, and prom-operator respectively.
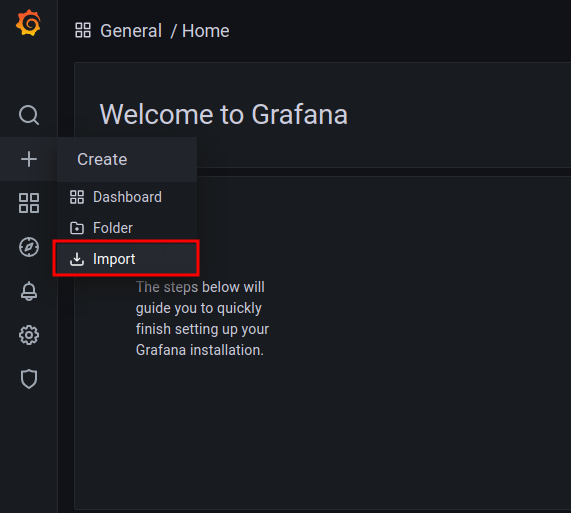
Then, on the Grafana UI, click the + icon from the left sidebar and then click on Import button as below,
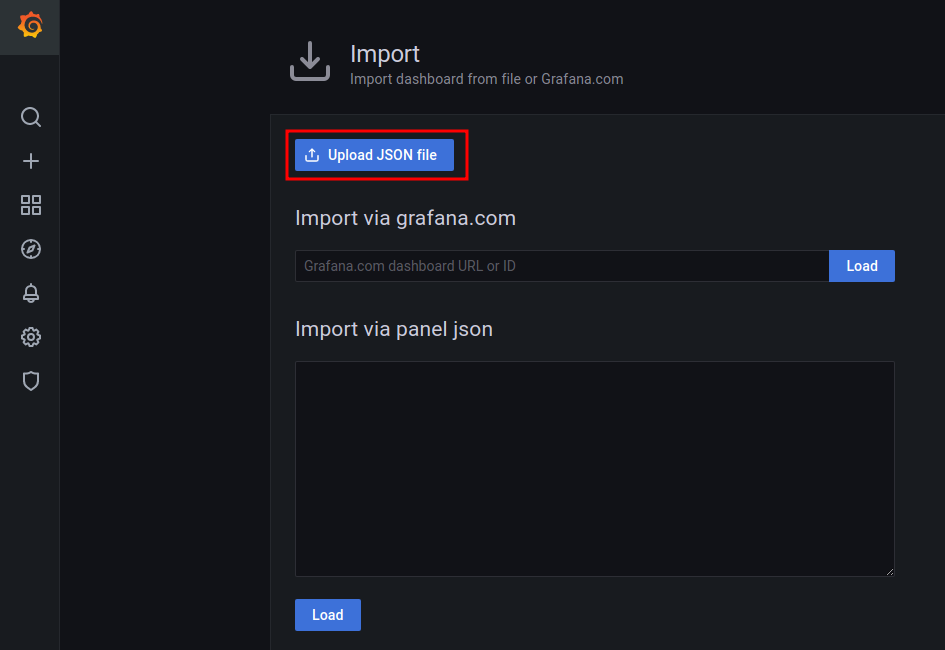
Then, on the import UI, you can either upload the noobaa_dashboard.json file by clicking the Upload JSON file button or you can paste the content of the JSON file in the text area labeled as Import via panel json.
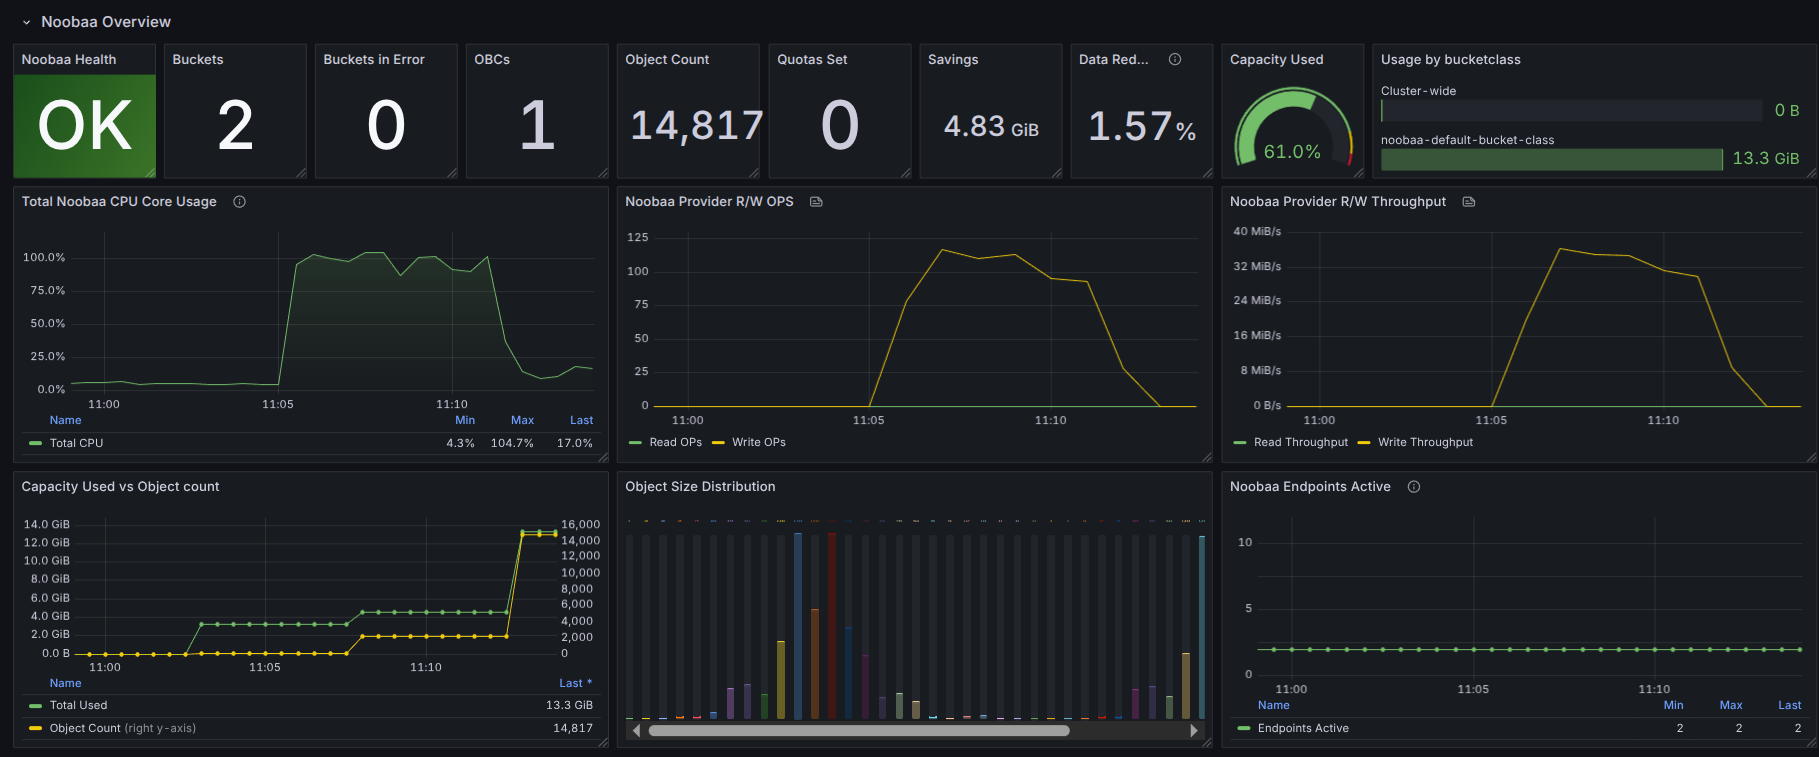
If you followed the instruction properly, you should see the NooBaa Grafana dashboard in your Grafana UI.